Connectors
Displays in this View are:
| • | Solace Connectors Table |
| • | Solace Connector Summary |
| • | Solace Workflows Table |
| • | Solace Workflow Trends |
Note: Metrics for Solace PubSub+ Cloud-Managed Micro-Integrations are available from the Clients displays, where a micro-integration connector will appear as a REST delivery endpoint. These Connector displays and procedures are specific to Solace PubSub+ Self-Managed Connectors.
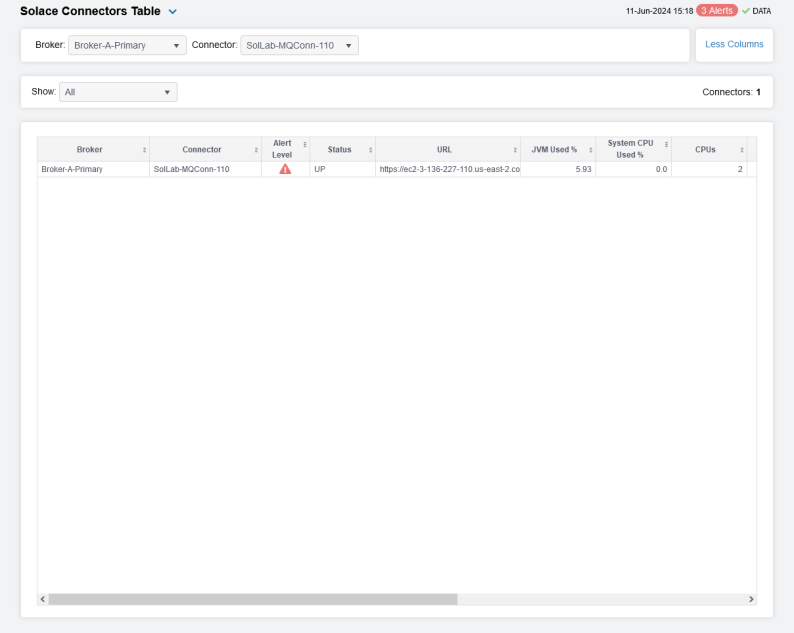
Solace Connectors Table
The Connectors Table display contains a table with one row for each connector, populated by the SolConnectors cache. Select a Brokerand Connector from the drop-down menus to filter the contents of the table.
Click a column header to sort column data in numerical or alphabetical order. Search by clicking the right side of a column heading Filter to open the Search, Sort and Choose Columns dialog:
Double-click a row to drill down for that broker to the Solace Connector Summary display.
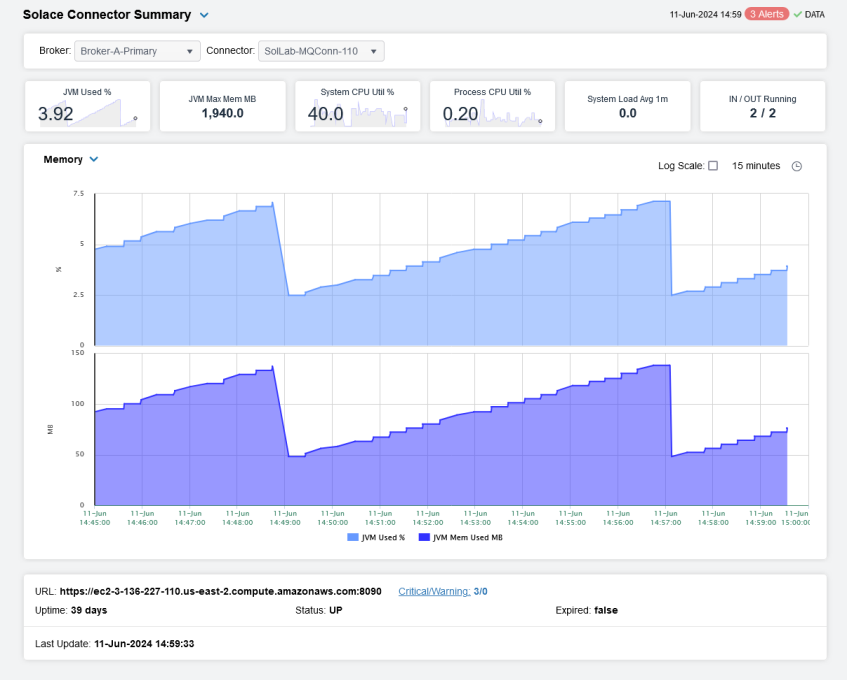
Solace Connector Summary
Select a Broker and Connector from the drop-down menus.
You can hover over the metric cards to see more performance metrics and drill down to return to the Solace Connectors Table, filtered for the selected connector.
The bottom half of the display provides current and historical performance metrics for the selected workflow. The trend graph traces the performance metric you select: Memoryor CPU Util.
You can hover over the trend graph to see the values at a particular time. You can specify the time range for the trend graph and view data based on a log scale, which enables visualization on a logarithmic scale and should be used when the range in your data is very broad.
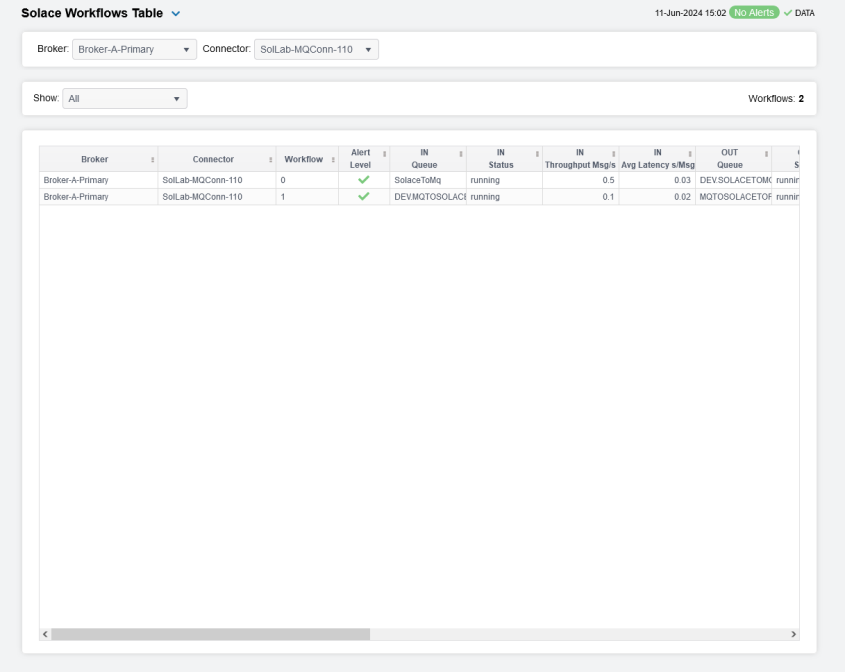
Solace Workflows Table
The Workflows Table display contains a table with one row for each workflow, populated by the SolConnectorFlows cache. Select a Brokerand Connector from the drop-down menus if you wish to filter the contents of the table.
Users can choose whether the table will show All, Expired Only, or Unexpired Only workflows.
Click a column header to sort column data in numerical or alphabetical order. Search by clicking the right side of a column heading Filter to open the Search, Sort and Choose Columns dialog.
Double-click a row to drill down for that broker to the Solace Workflow Trends display.
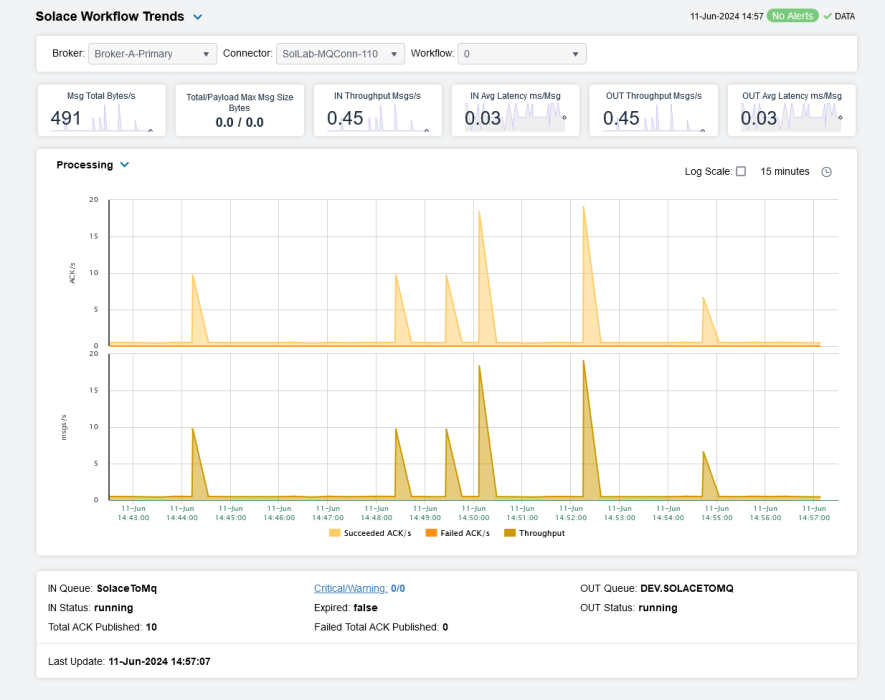
Solace Workflow Trends
Select a Broker, Connector, and Workflow from the drop-down menus.
You can hover over the metric cards to see more performance metrics and drill down to return to the Solace Workflows Table, filtered for the selected workflow..
The bottom half of the display provides current and historical performance metrics for the selected workflow. The trend graph traces the performance metric you select: Processing or Traffic.
You can hover over the trend graph to see the values at a particular time. You can specify the time range for the trend graph and view data based on a log scale, which enables visualization on a logarithmic scale and should be used when the range in your data is very broad.